The trait-analysis feature lets you check the distributions of your
traits, examine and export parametric and nonparametric correlations
between pairs of traits, and create new traits based on univariate or
multivariate transformations. It is opened from the main QGene menu
Analysis/Trait analysis when a data set is selected in the
Data Manager window.
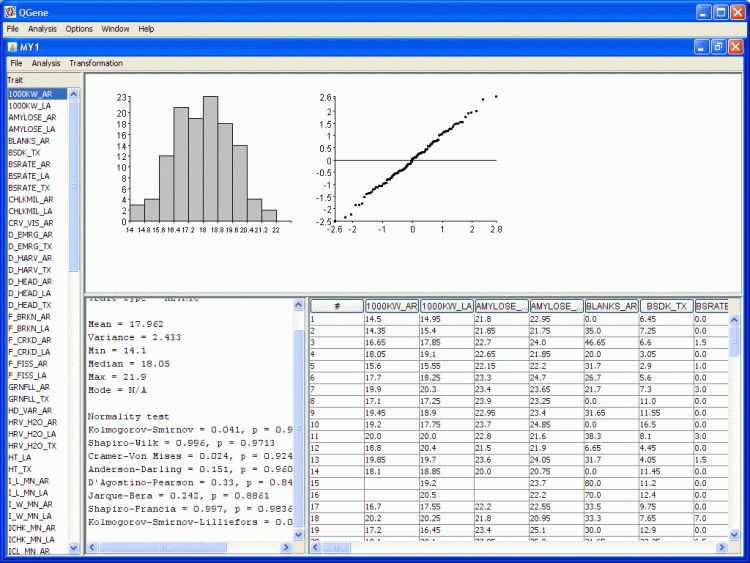
- In the trait-data table at bottom right, clicking in any of the column headers results in sorting the table on that column. An arrow icon appears in the header to show the current sort direction, which may be reversed with another click.
- The figure at top right is a so-called Q-Q or normal-scores plot. A straight diagonal line of points indicates near-normal distribution of the trait values, while curves and outliers from the diagonal axis show characteristic deviations from normality. The summary-statistics panel at lower left presents an absurd variety of statistics for evaluating the rarity of these figures under the null hypothesis of normality.
Comparing traits
This feature presents tables of two-way correspondence between traits whose names were selected in the trait list shown at left of the Trait analysis window above. The dropdown menu showing Trait correlation also leads to covariance and nonparametric correlation matrices.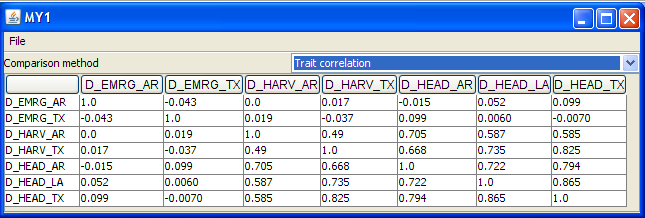
Transforming traits
- QTL mapping methods that fit linear models require the errors
(differences between observed phenotype values and those predicted
under the model) to be normally distributed. You can't tell by looking
at the phenotypic distribution whether any given model will give normal
residuals, so you shouldn't automatically transform the data.
- The transformation selected in the Transformation menu of the Trait analysis window is applied to all traits selected in the list. Transformed traits are appended to the end of the list. Note that any other analysis windows currently open are not updated to show the new traits.. For instance, if you have a QTL-analysis window open, you will need to close it and open another in order to analyze your new traits.
Regressing traits
This is QGene's awkward term for removing from a selected trait the linear contributions from selected "factor" traits. In effect this operation makes covariates out of the factor traits. The residuals from this operation are uncorrelated with the factor traits, so when you use them in a QTL analysis any QTLs must represent genetic effects that are independent of those traits. The interface for creating a "residual" trait is shown here: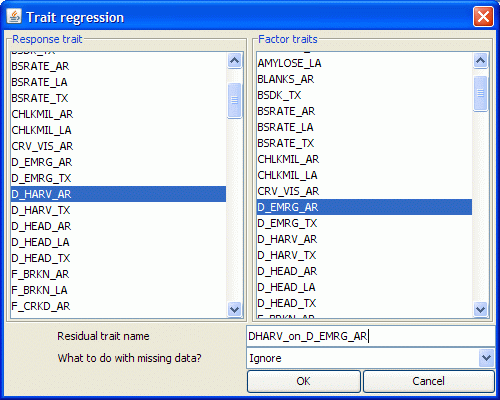
- Note that you can select any number of traits as factor traits but only one as a response trait.
- At this writing (11.07), the "What to do with missing data?" feature should be ignored, since we have not added imputation methods. Individuals with data points missing in either the response or the factor traits will have missing data for the residuals trait. If you select more factor traits than individuals with complete data, you'll create an estimation problem -- but it's unrealistic to select more than two or three factors anyway.
- As with transformation, the new traits created in this operation will not be seen in any analysis window currently open. Close and reopen such windows.