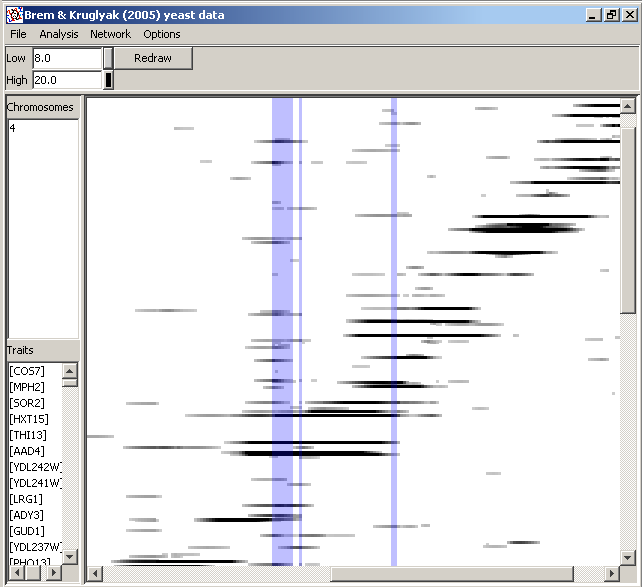
Expression data can be subjected to the same QTL analyses as ordinary trait data. For this the main QTL-mapping window may be used. Usually, however, analysts will want to view a "heat map" showing the combined results from all of the e-traits. Further operations may include network reconstruction and export, not yet available as of QGene version 4.3.
Here, as in other sections of the manual, we present only QGene's
analysis features without discussing in depth the algorithms behind
them. These are or will be covered elsewhere.
- The Data format page explains
the modified format necessary for including physical positions for
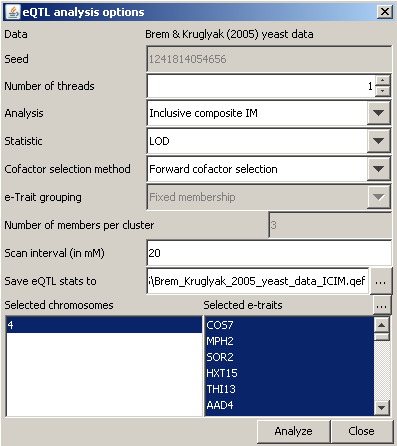
e-traits and markers in an eQTL data set. Once your eQTL .qdf file has been loaded, choose Analysis/eQTL analysis. In the eQTL-mapping
window, choose
 Analysis/New analysis, choose a mapping method in the Analysis dropdown
menu, and adjust the other parameters as desired. You may limit the
chromosomes and e-traits by appropriate selection in the lists at the
bottom of the dialog.
- The Seed field governs only Bayesian interval analysis and is disabled if any other mapping method is selected. If you wished to make a BIM analysis reproducible you would record the seed before starting it.
- The Number of threads field can be left alone. If you wonder what it's good for: it governs how much of your computer's CPU will be devoted to the analysis you're about to start. QGene will, by default, maximize this and you won't be able to do much else on the computer while the eQTL analysis is running. So if you wanted to share the CPU (at the cost of slowing down the eQTL analysis) you could reduce the number of threads used, assuming a number greater than 1 is showing in this field. In general this is a geeks-only option -- most analysts should just ignore it!
- If any multiple-trait QTL-mapping method is selected, the e-Trait grouping and Number of members per cluster fields are enabled. QGene needs to know how to cluster traits for the multiple-trait analysis. Under the first menu are two choices: Fixed membership and Name-based membership. If the first option is chosen, e-trait clusters of the size entered in Number of members per cluster will be taken in turn from your data set in the order of loading. If, in contrast, the second option is chosen, QGene forms clusters from e-traits having the same tag preceding or following a separator character that you may specify. For example, if your e-traits were formatted in sets looking like a_YORF333 and b_YORF333 you would specify that the separator is _ (the default character) and would clear the Is tag at front? checkbox to show that the tag follows the separator. These options allow you to predefine clusters by any desired method and incorporate this information in your .qdf input file.
- Once you've set the parameters, click Analyze. A progress dialog will appear until calculation is complete. All QTL stats will be written automatically to the .qef file specified in the dialog, unless you cleared the file name from the Save box. If you Cancel the analysis before it is done, the .qef file is simply closed.
You may resume the analysis where it was stopped, using Analysis/Resume analysis.
Since results are recorded as they are calculated, this option will work even if QGene should run out of memory and quit.
This feature has been available since version 4.3.0.

- In the heat-map display, you can adjust the range of the QTL statistic that determines the intensity of plotting, by changing the values in the Low and High boxes and clicking Redraw. You can also specify the colors corresponding to these thresholds. The points will then be drawn with colors derived from interpolation between the RGB values based on the position of the QTL statistics in the specified range.
- At present, selecting the chromosome and/or trait names has no effect. An obvious feature would be to allow selection of these to highlight the corresponding features in the heat map.
- Choosing Analysis/Find hotspots will allow you to apply a permutation method to find QTL or marker positions in the heat map where the density of points with statistical scores exceeeding a user-specified threshold has a user-specified low probability under a hypothesis of uniform distribution across the map. These positions are then reported and highlighted (as shown in the image above) on the heat map. Often the method detects several adjacent positions, as you will see from the text and graphical output.
- Choosing Analysis/New permutation analysis tells QGene to compute statistical acceptance cutoffs for the specified number of e-traits, using the specified number of shuffles per trait, and report the minimum and maximum (over the set of e-traits) values encountered. The permutation data are also saved to a file (.qpf) and a permutation run may be resumed in the same way as the main eQTL analysis.
- If you choose Analysis/Calculate heritability,
QGene fits for each e-trait a multiple-regression model containing all
the markers (or QTLs, depending on the QTL analysis method you chose)
that fell into the acceptance range you chose. Then it returns summary
statistics for the r2 values.
- Note: You can apply an
eQTL analysis to any QTL data set without having loaded it as an eQTL
dataset. Try it! The only caution is that the QTL-mapping method you
choose should be appropriate for all the traits. For example, applying
SIM or MIM to categorical data just creates nonsensical statistics.
Here's where the GLZ mapping options may be useful. They will apply the
right model to any trait that's encountered.
QEF output format
- TO BE ADDED