This window's purpose is to list the QGene data sets currently in memory
and show any map, genotype, or trait data they contain. Selecting a dataset in the Data panel
at left will make it the subject of the tabbed views in the right-hand
panel and of the operations under the main window's Analysis menu.
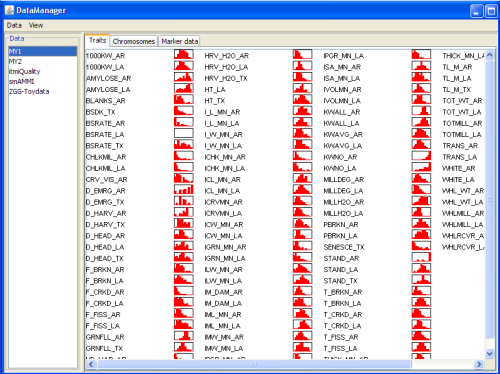
The Traits view shows the distributions of phenotypic data for each of the traits in the dataset. To view these in more detail, select the Analysis/Trait analysis
main menu item. Starting with version 4.3, mini-histograms are not
shown in the Data Manager if the number of traits in the data file
exceeds 200. This saves memory for analyses such as eQTL analysis that
consume a lot of it.
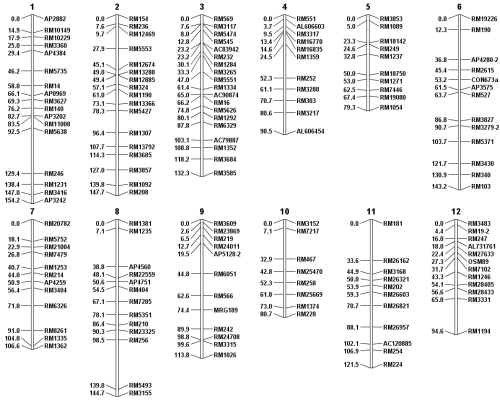
Clicking on the tabs in the right-hand panel shows the chromosome map, which you can scale by holding down the
Control key and turning the mouse wheel.
and the marker-genotype data, if available, for any data set selected in
the Data list at left of the Data manager window.
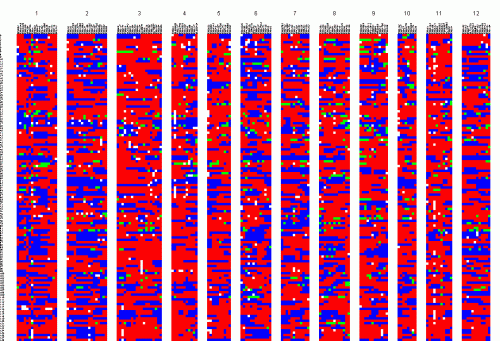
You can scale this image in the same way as the map.
When finished with any data set, you can choose Delete from the window's
Data menu to remove it from memory.
As with most QGene display windows, you can use the View/Save image...
menus to export the image to the Clipboard as a .jpg, or to a file
in a wide variety of image formats.